Nginx status page can give us realtime information about the server’s current status, such as number of connections and requests.
Configure Nginx
Run this command to check if your Nginx server support status page:
nginx -V 2>&1 | grep -o with-http_stub_status_module
Edit Nginx config file and add the following inside server{…} block:
 location /nginx_status {
          stub_status on;
          access_log   off;
          allow 1.1.1.1;
          deny all;
        }
Then reload Nginx config:
nginx -s reload
After reloading config, visit http://yourdomain.com/nginx_status and the output will be something like:
Active connections: 81
server accepts handled requests
 12132 12132 15001
Reading: 0 Writing: 3 Waiting: 5
Notes:
-
Active connections – Number of all open connections. This doesn’t mean number of users. A single user, for a single page view can open many concurrent connections to your server.
-
Server accepts handled requests – This shows three values. 1. First is total accepted connections. 2. Second is total handled connections. Usually first 2 values are same. 3. Third value is number of accepted and handles requests. This is usually greater than second value. 4. Dividing third-value by second-one will give you number of requests per connection handled by Nginx. In above example, 15001/12132, 1.24 requests per connections.
-
Reading – Nginx reads request header
-
Writing – Nginx reads request body, processes request, or writes response to a client
-
Waiting – keep-alive connections, actually it is active – (reading + writing).This value depends on keepalive-timeout. Do not confuse non-zero waiting value for poor performance. It can be ignored. Although, you can force zero waiting by setting keepalive_timeout 0;
Configure SysUpTime
-
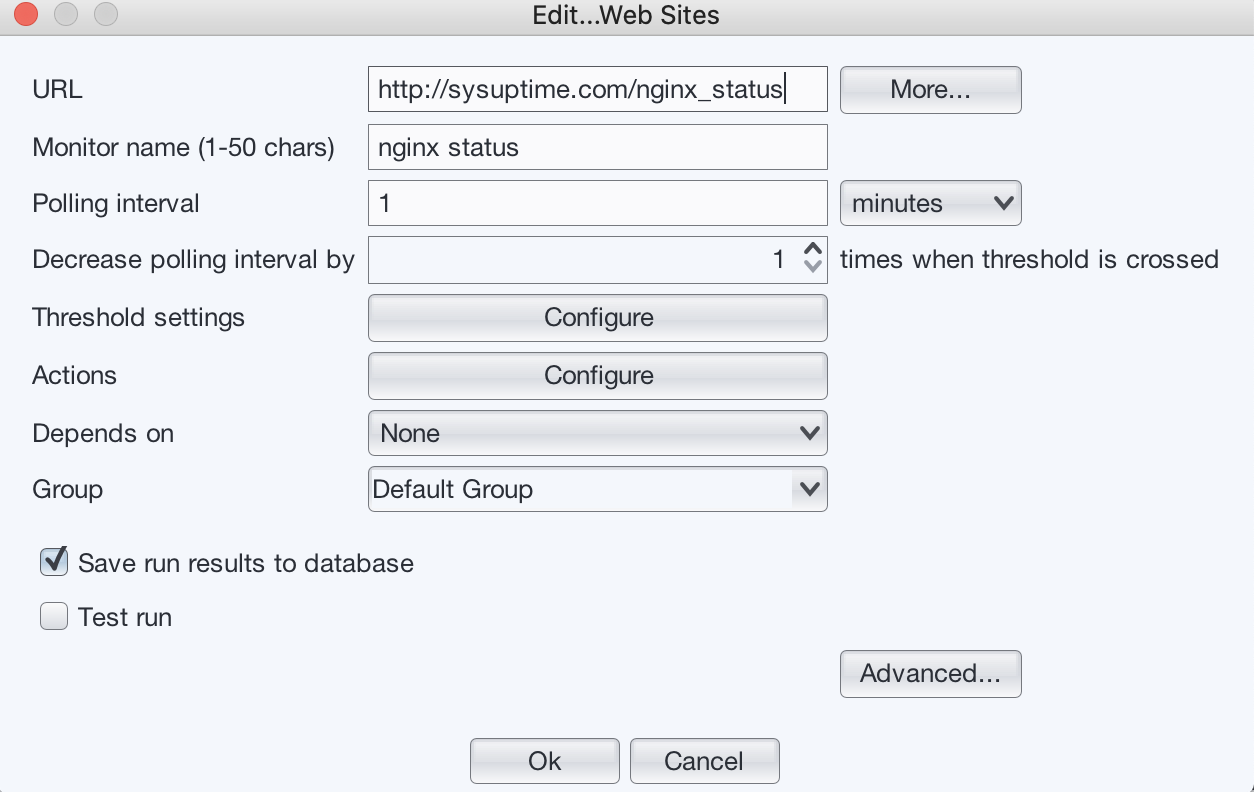
Add a web site monitor:

-
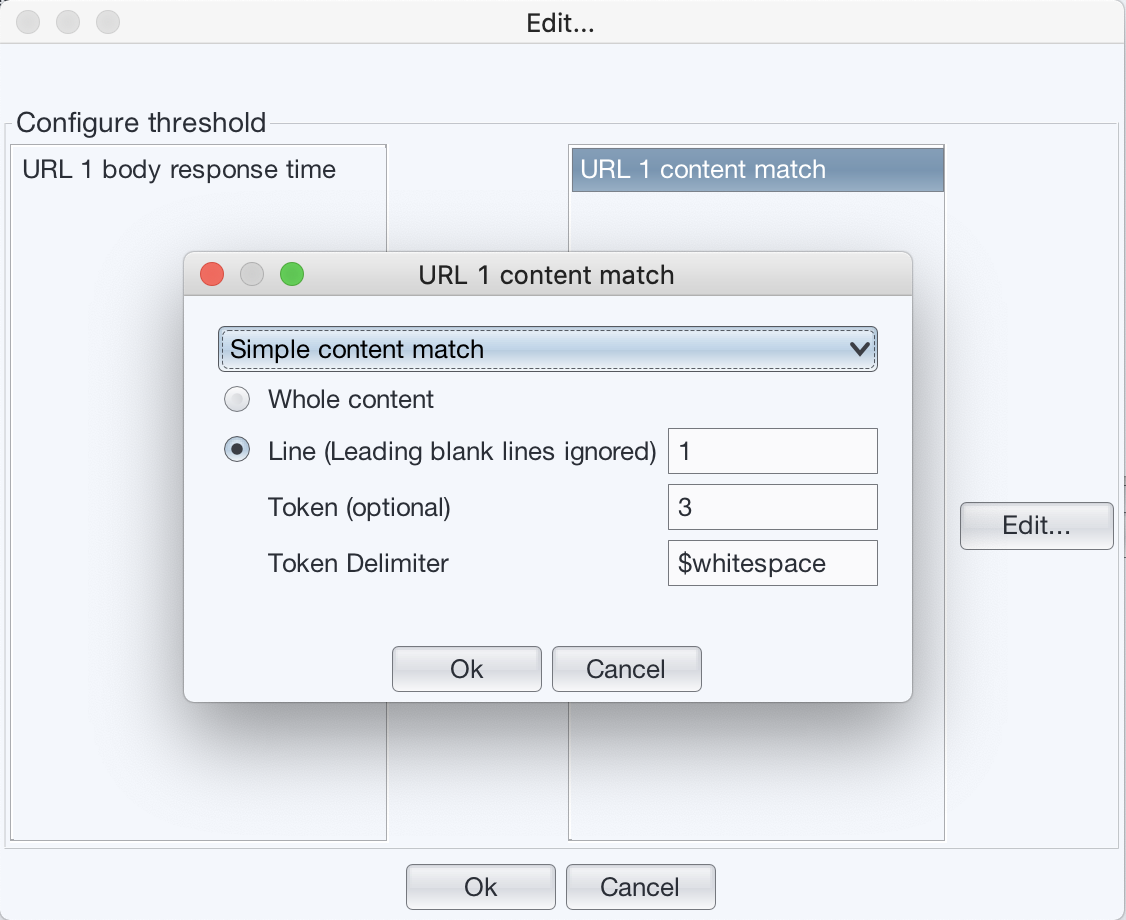
Configure it to use simple content match, and choose the third token of first line of the http response, which is the value of active connections.

-
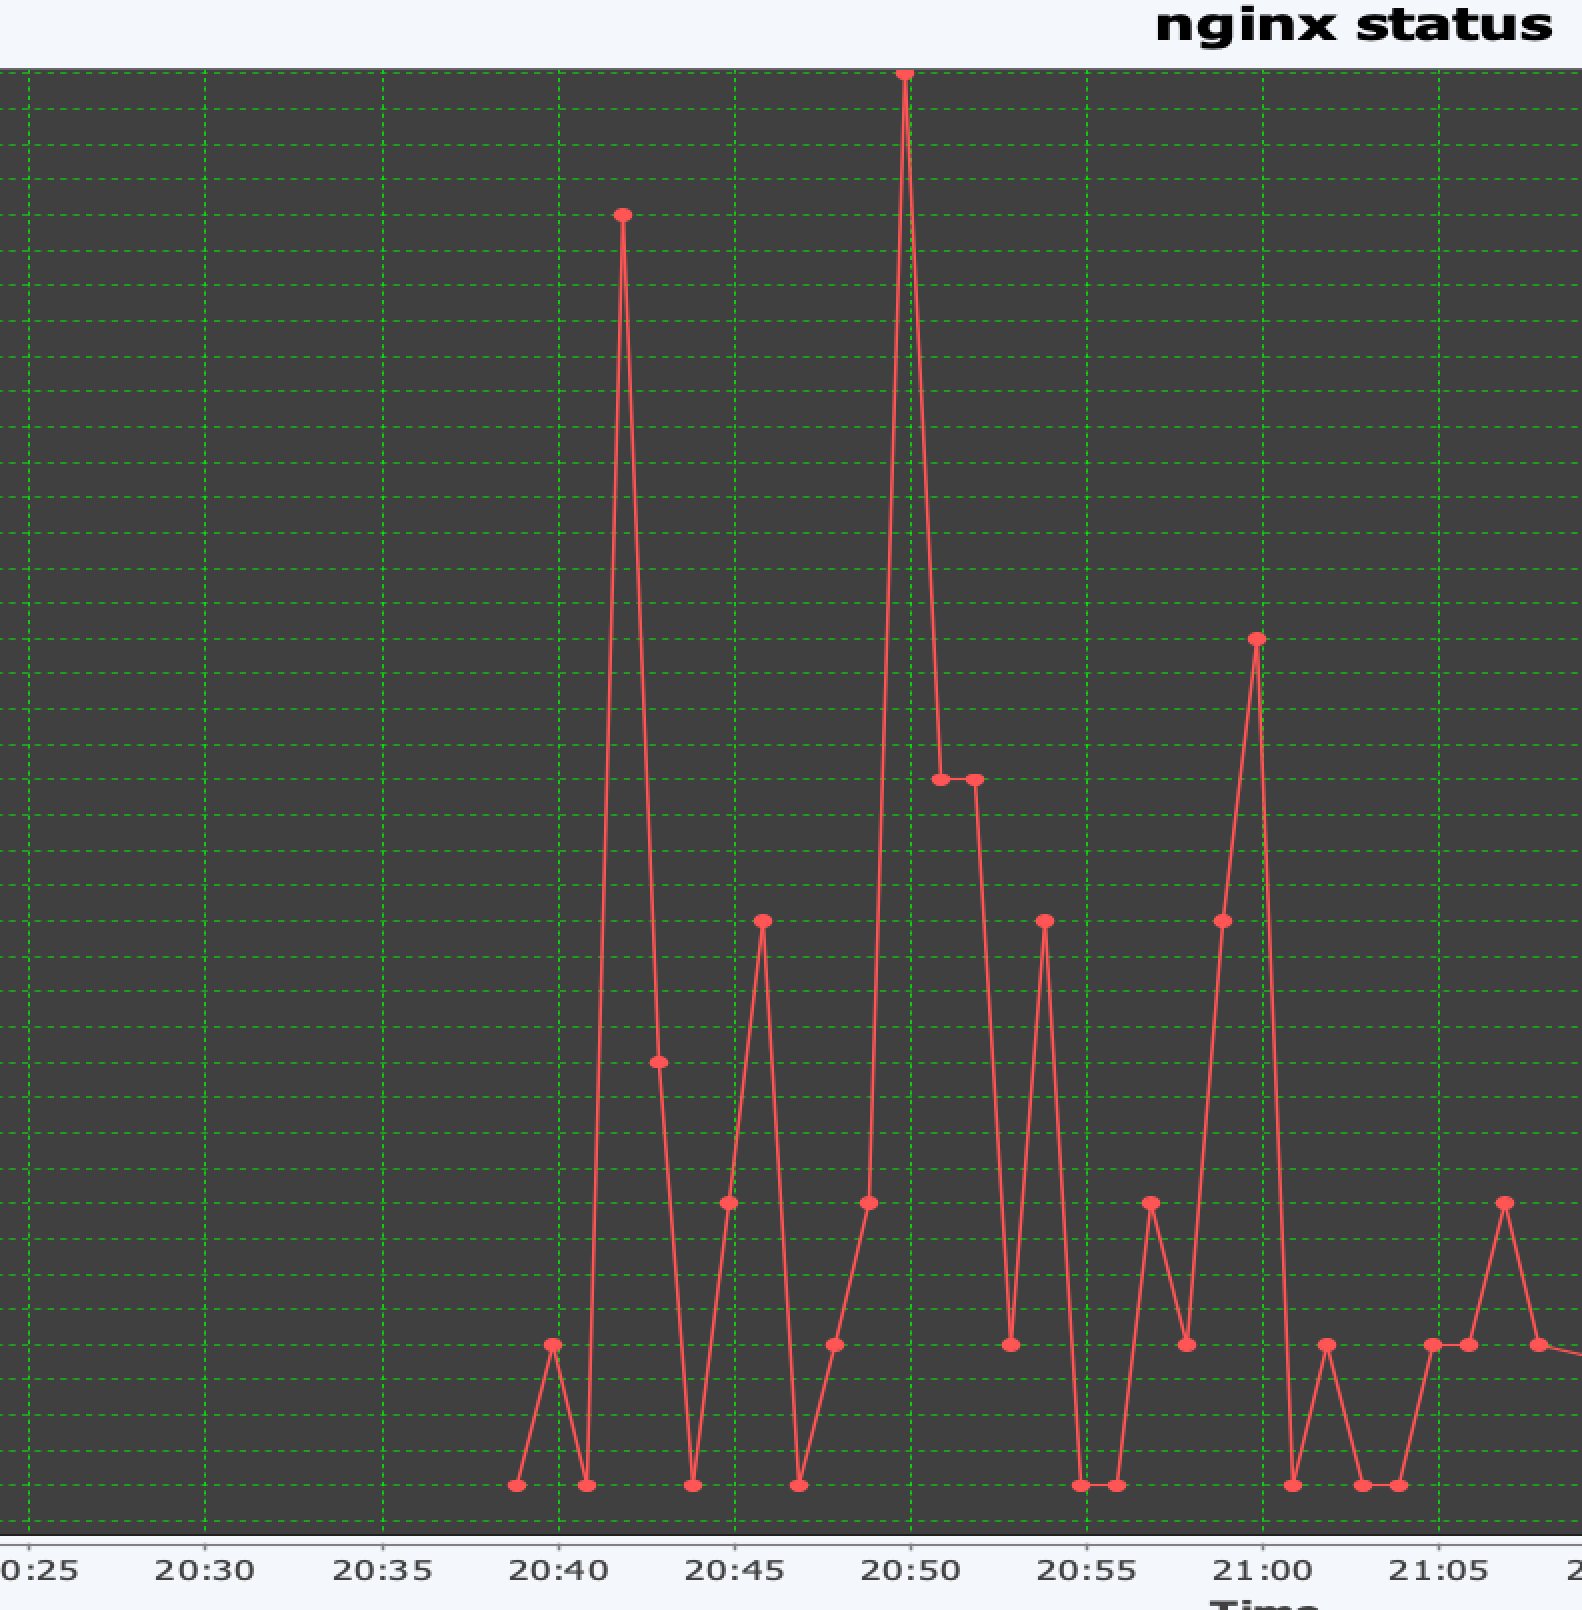
The chart of the monitor will be something like:
